Phenix
Calculate electron densities using Phenix
Here are a couple of useful phenix commands to calculate electron densities. In docking, it is often useful to have a look at electron densities, especially for proteins and ligands determined at low resolution. Also, you may want to display them in Pymol: here[link] is described how you generate a electron density map in CCP4 format map, which is required for Pymol.
1. Download PDB coordinates and structure factors from PDB.ORG
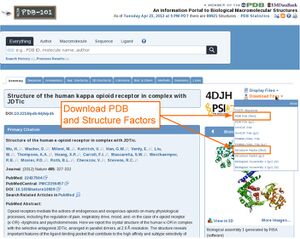
To calculate a electron density, you need to download PDB coordinates and structure factors (Miller indices and measured intensities) from the PDB. On pdb.org, there is a dropdown menu on the right top corner of each entry site where PDB and structure factors can be downloaded (see image on the right).
2. Calculate electron densities from deposited structure factors
You can calculate an electron density (CCP4 format for Pymol and mtz format for Coot) using a PDB and structure factors using Phenix.
If you want a 2Fo-Fc map, simply type:
phenix.maps 4DJH.pdb 4djh-sf.cif
If you want a Fo-Fc difference density map from deposited structure factors, type:
phenix.maps 4DJH.pdb 4djh-sf.cif maps.map.map_type=Fo-F
3. Calculate a simulated annealing (SA) omit map
Sometimes it is interesting to see how much density of a ligand is left upon removal of the ligand (or protein residues or water molecules) from your model.
You can calculate a simulated annealing (SA) omit map using Phenix like this:
# remove ligands and water molecules
grep -v HETATM 4DJH.pdb > 4DJH_no_HETATM.pdb

# Run Phenix refinement including simulated annealing
phenix.refine 4djh-sf.cif 4DJH_no_HETATM.pdb simulated_annealing=true

# Generate a CCP4 map for Pymol:
phenix.maps maps.map.map_type=Fo-Fc 4DJH_no_HETATM.pdb 4DJH_no_HETATM_refine_001.mtz
4. Display electron densities in Pymol
Pymol wants CCP4 maps as input. To generate those, we use Phenix as described above.
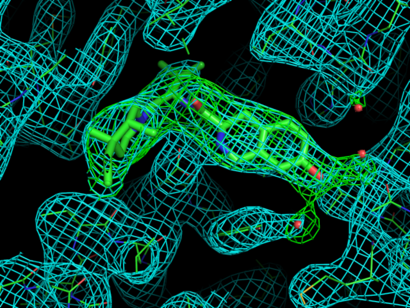
Here is a Pymol script to show density around the ligand and it's surrounding residues:
load 4DJH.pdb, kappa_opiod_rec
load 4DJH_2mFo-DFc_map.ccp4
load 4DJH_no_HETATM_Fo-Fc_map.ccp4, SA_omit

select lig, resn JDC AND chain A
cmd.show("sticks"    ,"lig")
select around_lig, lig expand 10

isomesh fo-fc_map, SA_omit, 3.0, around_lig
isomesh 2fo-fc_map, 4DJH_2mFo-DFc_map, 1.0, around_lig
cmd.color(5,"2fo-fc_map")
cmd.color(3,"fo-fc_map")

orient lig

set_view (\
    -0.552325428,   -0.811329126,   -0.191545352,\
     0.833266199,   -0.543944836,   -0.098800458,\
    -0.024021570,   -0.214180335,    0.976500750,\
     0.001199273,   -0.000215724,  -52.703464508,\
     4.263263702,  -21.972831726,   57.798912048,\
    48.832965851,   56.566112518,  -20.000000000 )

set ray_shadow, off
Acknowledgments
Thanks to the Phenix and Pymol developers.

