Interactive ligands visualizer
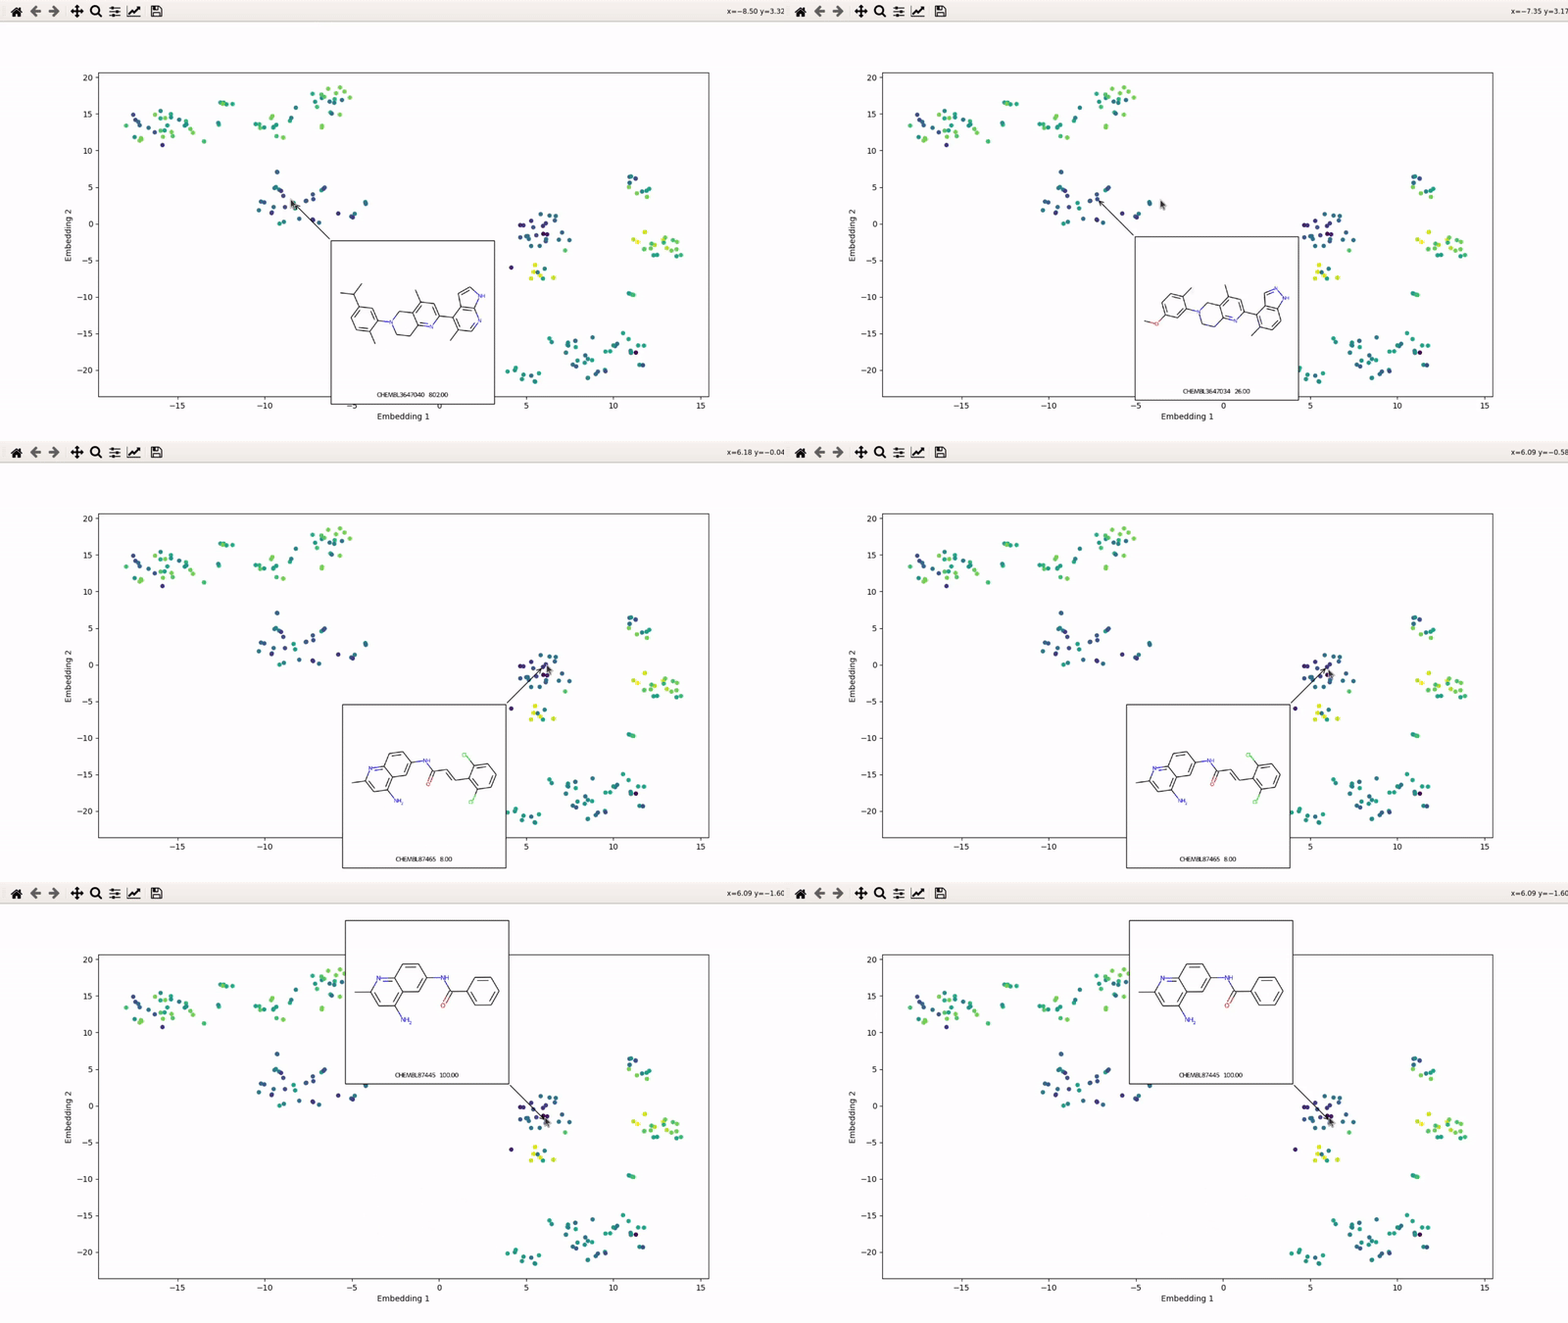
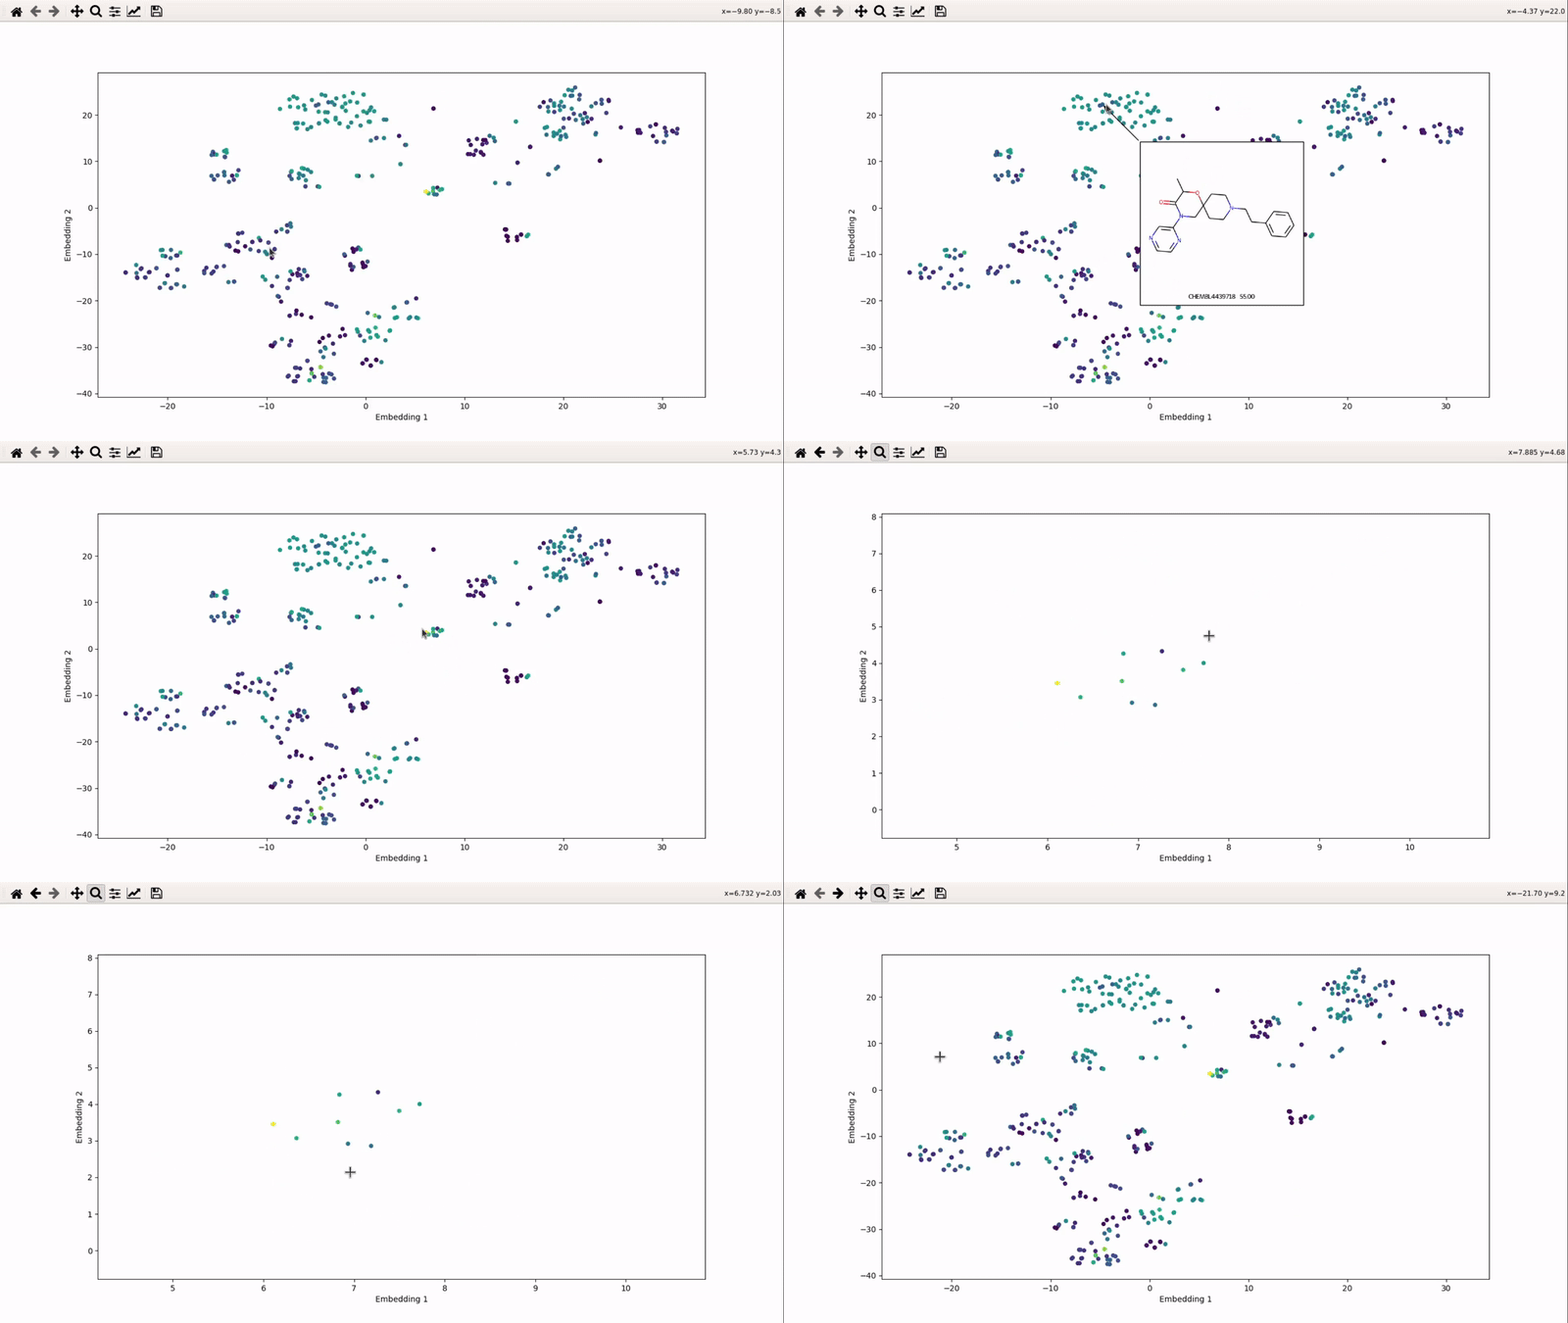
I (Olivier) put together this interactive visualizer to make sure that I don't miss out some chemotypes when coming up with actives at the start of a retrospective campaign. Starting from a downloaded ChEMBL CSV file for a list of ligands, images of each molecule are generated with RDKit and a text file with filtered Smiles is generated. You then need to compute the ECFP fingerprints on Gimel from that file (see below), and then a generated script will show an interactive visualization of the chemical space spanned by the ligands (tSNE), with each molecule shown on mouse hovering.
Step 1: install chemspace_vis package
The visualizer will need to be installed on your local machine, not the cluster.
Make sure you are using Python 3, and then simply:
pip install chemspace_vis
N.B. This only works on Mac and Linux, sorry Windows users (if you exist).
For those interested, the source code can be found on my GitHub: https://github.com/gregorpatof/chemspace_vis_package
Step 2: obtain ChEMBL CSV file (or use provided example)
Any ChEMBL CSV from a given activity of a given target will do. If you want to run the visualizer directly from smiles and fingerprints, see bottom of page.
You can also clone the example repository, which contains the CSV for mu-opioid ligands with measured Emax and an example script:
git clone https://github.com/gregorpatof/chemspace_vis_example
Just to make things too clear, here is how I obtained that CSV:
Step 3: extract Smiles and activity for given HAC and MW filters
This is accomplished by the preprocess_part1() method in the example script, which runs a single command:
from chemspace_vis.preprocess import preprocess_chembl

chembl_csv = "mor_chembl_emax.csv"

activity_name = "Emax" # The text name of the activity (in this case, Emax)
preprocess_chembl(chembl_csv, activity_name, max_hac=35, max_mw=600, img_folder="mol_images")
As you can see, you can specify the maximum number of heavy atoms (max_hac) and maximum molecular weight (max_mw) for the ligands to keep.
This will generate two files: a .smi file with the Smiles for all the kept ligands, and .df file which keeps the activity value (Emax here) in dataframe format.
It also generates all 2D images of your molecules, with ChEMBL ID (or other, it is taken from the .smi file) and activity included, in the mol_images folder.
Step 4: compute the fingerprints on Gimel
Copy the .smi file to gimel, source the DOCK3.7 base, and then run this command (on gimel, not gimel2 or others):
python ~jklyu/zzz.github/ChemInfTools/utils/teb_chemaxon_cheminf_tools/generate_chemaxon_fingerprints.py mor_chembl_emax.smi mor_chembl_emax
This will generate a .fp file, in the present case mor_chembl_emax.fp
I personally like to use bash, so the way I source the DOCK3.7 base is:
export DOCKBASE=/nfs/soft/dock/versions/dock37/DOCK-3.7-trunk
source /nfs/soft/dock/versions/dock37/DOCK-3.7-trunk/env.sh
Step 5: tSNE and interactive visualization
Almost done! Copy the .fp file back to your machine, then run part 2 of the example script:
from chemspace_vis.preprocess import make_tsne_from_fingerprints
from chemspace_vis.visualizer import make_visualizer_script

fingerprints_file = "mor_chembl_emax.fp"
make_tsne_from_fingerprints(fingerprints_file)
make_visualizer_script("tsne_data.df", "mol_images", activity_filename="mor_chembl_emax_activity.df", use_log10=False)
The first command will compute tSNE from the fingerprints. You will see a print telling you what percentage of the variance is covered by the PCA first applied (anything over 90-95% is good).
If you get an error that looks like this:
ValueError: n_components=180 must be between 0 and min(n_samples, n_features)=91 with svd_solver='full'
It means that you have less than 180 molecules in your list. Simple change the number of requested components to a number below your number of molecules:
make_tsne_from_fingerprints(fingerprints_file, n_pca_components=SOME_NUMBER_LESS_THAN_N)
Then, the visualizer script will be generated. If you supply an activity filename, you will get coloring based on that property (here, Emax). The use_log10 flag can be useful if you have extreme values driving the coloring.
Step 6: run the visualizer
Simply run the generated visualizer script:
python visualizer_script.py
You can then zoom on parts where ligands are close together, and go back to the general view with the back arrow:
Optional: run directly from Smiles and fingerprints
For this, you will bypass the ChEMBL processing step. Simply generate the images:
from chemspace_vis.preprocess import generate_images

generate_images("you_smiles.smi", "mol_images", activity_fn=None)
And then run the second step, without an activity file:
from chemspace_vis.preprocess import make_tsne_from_fingerprints
from chemspace_vis.visualizer import make_visualizer_script

fingerprints_file = "mor_chembl_emax.fp"
make_tsne_from_fingerprints(fingerprints_file)
make_visualizer_script("tsne_data.df", "mol_images", use_log10=False)


