Visualizing delphi: Difference between revisions
m (formatting) |
(updating page with screenshots) |
||
| Line 1: | Line 1: | ||
Placeholder for tutorial on visualizing [[Delphi]] and understanding electrostatic scoring in DOCK. | Placeholder for tutorial on visualizing [[Delphi]] and understanding electrostatic scoring in DOCK. | ||
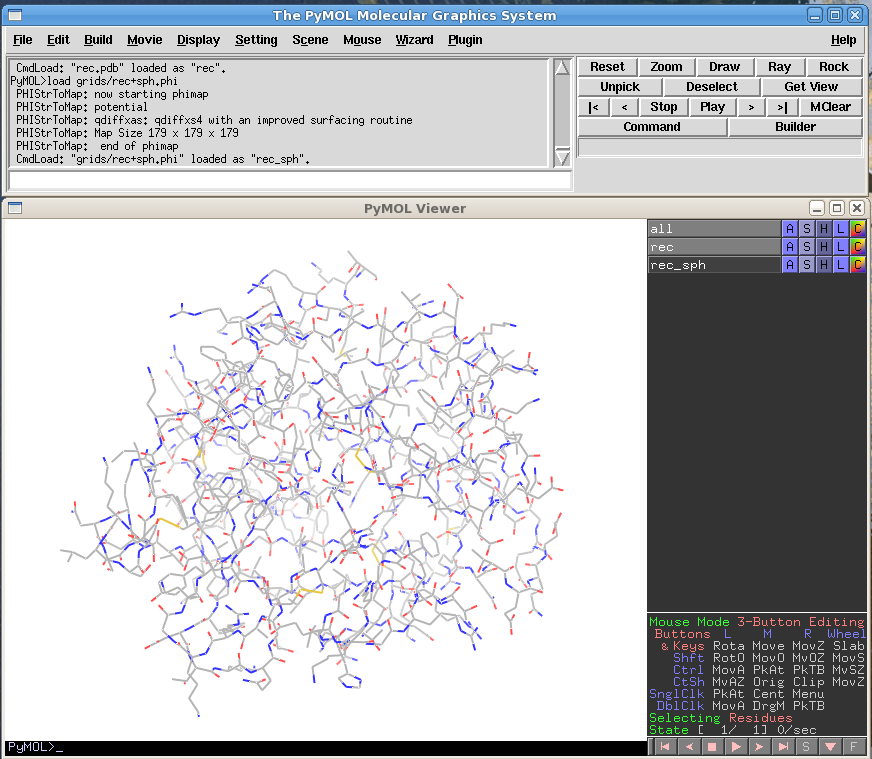
# | # Open the pdb and phi files in PyMOL | ||
# go to the apbs plugin | |||
In a normal DOCK run, this can be done by typing the following in the PyMOL command window: | |||
cd ~/directory/ | |||
load rec.pdb | |||
load grids/rec+sph.phi | |||
[[Image:pdb.png]] | |||
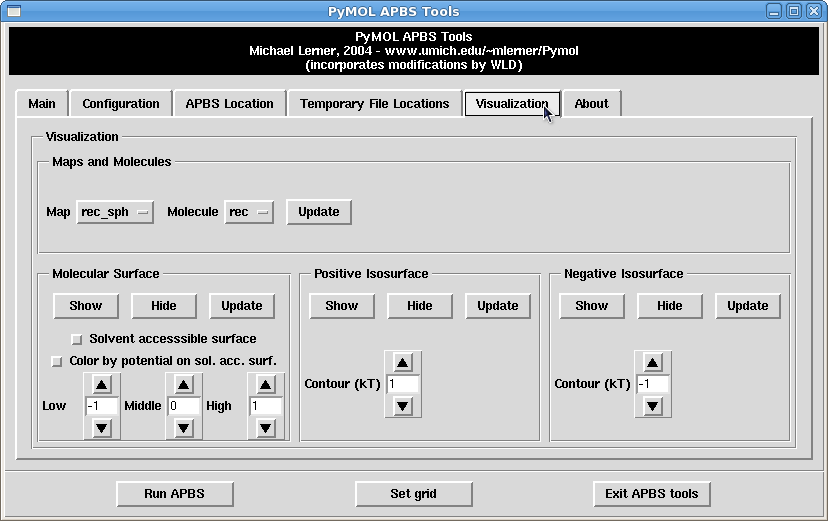
# go to the apbs tools plugin under the plugin menu | |||
[[Image:Apbs tool.png]] | |||
# go to the visualization tab | # go to the visualization tab | ||
[[Image:Visualization.png]] | |||
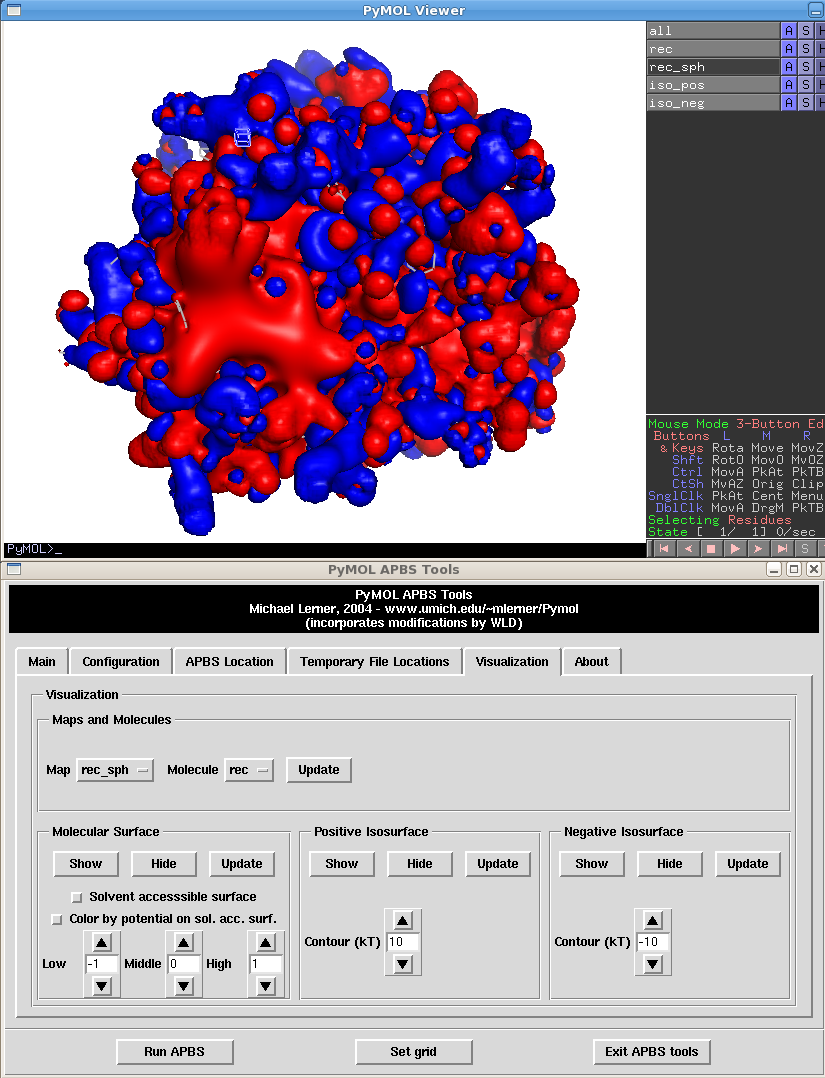
# display the potentials at a certain kT value | # display the potentials at a certain kT value | ||
For each kind of surface (Positive or Negative) you can set the value at which the isosurface will be drawn at. The following example is for 10 and -10: | |||
[[Image:Tenminusten.png]] | |||
This means that anywhere at this surface, the potential for a charged atom can be calculated as 10*charge (and roughly *0.6 to convert to kcal/mol instead of kT). Of course this is relatively meaningless over the whole protein, what really matters is near the binding site where ligands will be docked. | |||
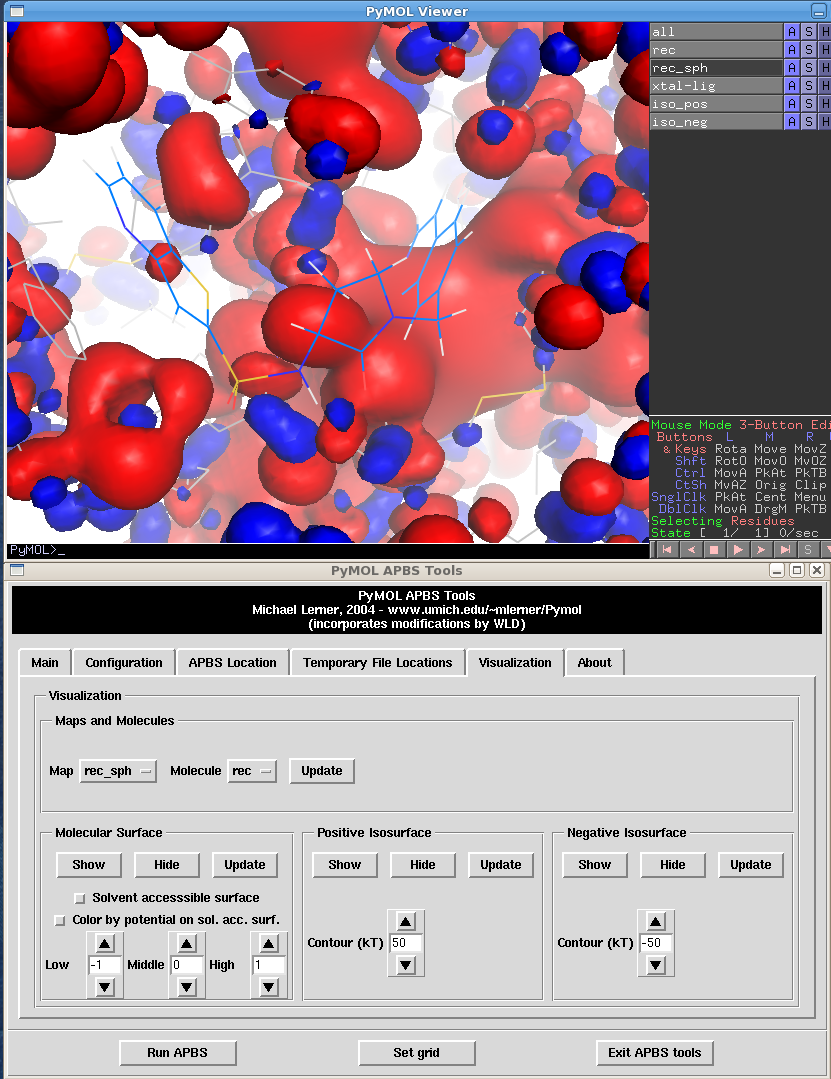
After loading the crystal structure ligand and zooming on it and changing the potentials to 50 and -50 you get the following: | |||
[[Image:50minus50ligand.png]] | |||
[[Category: Tutorials]] | [[Category: Tutorials]] | ||
Revision as of 15:45, 1 April 2010
Placeholder for tutorial on visualizing Delphi and understanding electrostatic scoring in DOCK.
- Open the pdb and phi files in PyMOL
In a normal DOCK run, this can be done by typing the following in the PyMOL command window:
cd ~/directory/
load rec.pdb
load grids/rec+sph.phi
- go to the apbs tools plugin under the plugin menu
- go to the visualization tab
- display the potentials at a certain kT value
For each kind of surface (Positive or Negative) you can set the value at which the isosurface will be drawn at. The following example is for 10 and -10:
This means that anywhere at this surface, the potential for a charged atom can be calculated as 10*charge (and roughly *0.6 to convert to kcal/mol instead of kT). Of course this is relatively meaningless over the whole protein, what really matters is near the binding site where ligands will be docked.
After loading the crystal structure ligand and zooming on it and changing the potentials to 50 and -50 you get the following:


