Interactive ligands visualizer: Difference between revisions
No edit summary |
No edit summary |
||
| Line 17: | Line 17: | ||
Any ChEMBL CSV from a given activity of a given target will do. | Any ChEMBL CSV from a given activity of a given target will do. | ||
You can also clone the example repository, which contains the CSV for | You can also clone the example repository, which contains the CSV for mu-opioid ligands with measured Emax and an example script: | ||
git clone https://github.com/gregorpatof/chemspace_vis_example | git clone https://github.com/gregorpatof/chemspace_vis_example | ||
Just to make things too clear, here is how I obtained that CSV: | |||
<gallery> | |||
chembl_mor1.png|Mu-opioid receptor on ChEMBL | |||
chembl_mor2.png|1100 ligands with measured Emax | |||
chembl_mor3.png|Generating the CSV | |||
</gallery> | |||
| Line 28: | Line 36: | ||
from chemspace_vis.preprocess import preprocess_chembl | from chemspace_vis.preprocess import preprocess_chembl | ||
chembl_csv = " | chembl_csv = "mor_chembl_emax.csv" | ||
activity_name = "IC50" # The text name of the activity (in this case, IC50) | activity_name = "IC50" # The text name of the activity (in this case, IC50) | ||
preprocess_chembl(chembl_csv, activity_name, max_hac=35, max_mw=600, img_folder="mol_images") | preprocess_chembl(chembl_csv, activity_name, max_hac=35, max_mw=600, img_folder="mol_images") | ||
Revision as of 22:21, 20 January 2023
I (Olivier) put together this interactive visualizer to make sure that I don't miss out some chemotypes when coming up with actives at the start of a retrospective campaign. Starting from a downloaded ChEMBL CSV file for a list of ligands, images of each molecule are generated with RDKit and a text file with filtered Smiles is generated. You then need to compute the ECFP fingerprints on Gimel from that file (see below), and then a generated script will show an interactive visualization of the chemical space spanned by the ligands (tSNE), with each molecule shown on mouse hovering.

Step 1: install chemspace_vis package
Make sure you are using Python 3, and then simply:
pip install chemspace_vis
N.B. This only works on Mac and Linux, sorry Windows users (if you exist).
Step 2: obtain ChEMBL CSV file (or use provided example)
Any ChEMBL CSV from a given activity of a given target will do.
You can also clone the example repository, which contains the CSV for mu-opioid ligands with measured Emax and an example script:
git clone https://github.com/gregorpatof/chemspace_vis_example
Just to make things too clear, here is how I obtained that CSV:
Mu-opioid receptor on ChEMBL
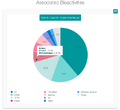
1100 ligands with measured Emax

Generating the CSV


Step 3: extract Smiles and activity for given HAC and MW filters
This is accomplished by the preprocess_part1() method in the example script, which runs a single command:
from chemspace_vis.preprocess import preprocess_chembl

chembl_csv = "mor_chembl_emax.csv"

activity_name = "IC50" # The text name of the activity (in this case, IC50)
preprocess_chembl(chembl_csv, activity_name, max_hac=35, max_mw=600, img_folder="mol_images")