Torsion against CSD visualize with Maestro
5/15/2020 Ying
Besides the automated strain filtering, it's useful to visualize the torsions in CSD. Here's an example of how to do it with Schrodinger tools.
1) Login to gimel. We only have valid CSD license on gimel.
2) Run the script:
csh /nfs/home/yingyang/scripts/search_csd.sh <mol2 file>
Output file is <filename>-out.maegz. When <filename>-out.maegz file is created, CSD search is done.
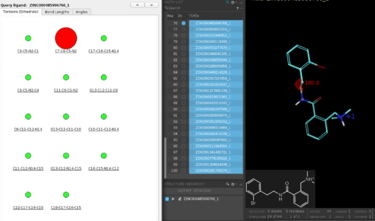
3) Visualize with Maestro. Import <filename>-out.maegz into maestro. Click Tasks, Type CSD, and then Click CSD Analysis.
A new window appears. Each torsion is shown qualitatively (green = ok and red = bad), and is interactive with the Workspace
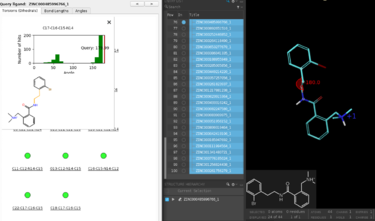
Click the specific torsion, eg. C17-C16-C15-N14, a histogram shows the distribution of torsion hits found in CSD.
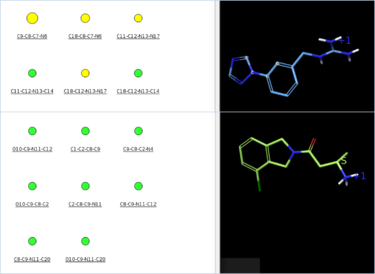
Ideally, ligands with green/yellow bubbles indicating good torsion.
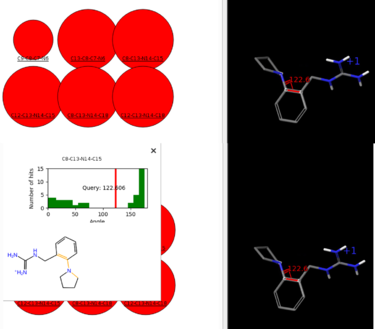
A large red bubble flags out problematic torsion which needs to be visually examined.


