Interaction Filtering: Difference between revisions
No edit summary |
No edit summary |
||
| Line 1: | Line 1: | ||
This is the 1st version (20200210) of Interaction Filtering. Please copy the code to your current directory. | This is the 1st version (20200210) of Interaction Filtering. Please copy the code to your current directory. | ||
FIRST AND FOREMOST, If you find any version conflicts between python 3.7 and 2.7. You need to comment out inside ~/.cshrc: # source /nfs/soft/dock/versions/dock37/DOCK-3.7-trunk/env.csh | |||
$ cp -r /mnt/nfs/home/sgu/code/interfilter . | $ cp -r /mnt/nfs/home/sgu/code/interfilter . | ||
| Line 8: | Line 11: | ||
$ conda activate oepython | $ conda activate oepython | ||
$ setenv OE_LICENSE /nfs/soft/openeye/oe_license.txt | $ setenv OE_LICENSE /nfs/soft/openeye/oe_license.txt | ||
Running the code: | Running the code: | ||
Revision as of 02:53, 15 February 2020
This is the 1st version (20200210) of Interaction Filtering. Please copy the code to your current directory.
FIRST AND FOREMOST, If you find any version conflicts between python 3.7 and 2.7. You need to comment out inside ~/.cshrc: # source /nfs/soft/dock/versions/dock37/DOCK-3.7-trunk/env.csh
$ cp -r /mnt/nfs/home/sgu/code/interfilter .
To run the code, you need OpenEye (version 2019.Oct.2). You can follow the instruction to install: https://docs.eyesopen.com/toolkits/python/quickstart-python/linuxosx.html
On our cluster, you may source my environment.
$ source /nfs/home/sgu/anaconda3/etc/profile.d/conda.csh
$ conda activate oepython
$ setenv OE_LICENSE /nfs/soft/openeye/oe_license.txt
Running the code:
$ python interfilter.py -protein rec.crg.pdb -ligand poses.mol2
If you want to know the interaction for a specific residue (e.g. ASP115A, A means chain A):
$ python interfilter.py -protein rec.crg.pdb -ligand poses.mol2 -residue ASP115A
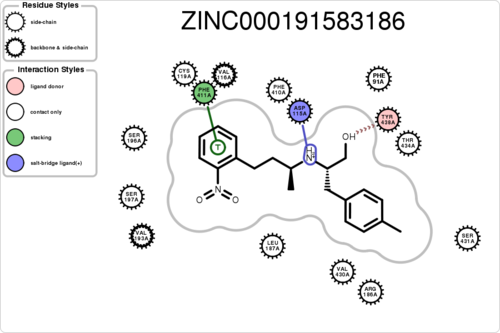
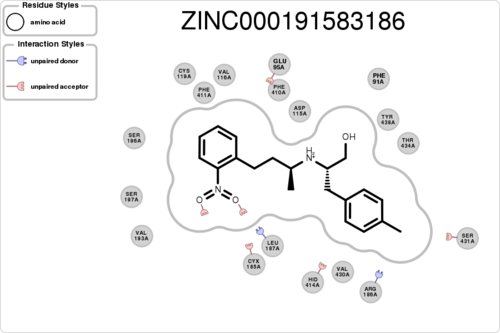
If you want to plot the paired/unpaired interaction (figure generation can be slow, but several thousand should be fine):
$ python interfilter.py -protein rec.crg.pdb -ligand poses.mol2 -residue ASP115A -plot
The output is a txt file, containing 15 columns: 1ligand 2clash 3hbond_clash+sbridge_clash 4unpairedl_donor+unpairedl_sbridge 5unpairedl_acceptor 6unpairedp_donor+unpairedp_acceptor 7unpairedp_sbridge 8contact 9hbond+hbond_nonideal 10hbond_ligand 11sbridge 12stacking 13cationpi 14halogen 15residue
To filter out compounds, you may be interested in:
Column3: #hydrogen bond clash + #salt bridge clash
Column4: #unpaired ligand donor + #unpaired ligand salt bridge
Column9: #hydrogen bond + #non-ideal hydrogen bond
Column11: #salt bridge
Column15: interaction for you specified residue (0 means no, 1 means yes)

