Dock Sampling: Difference between revisions
Oliv Eidam (talk | contribs) No edit summary |
Oliv Eidam (talk | contribs) No edit summary |
||
| Line 16: | Line 16: | ||
==Bioactive conformation sampled?== | ==Bioactive conformation sampled?== | ||
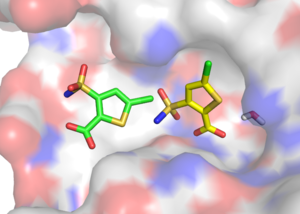
I want to make the following example: I predicted a fragment binding to the oxyanion hole, but when we determined the crystal structure, the fragment bound to the so-called distal site of AmpC (see picture on the right). | [[File:Nz14 xtal vs dock.png|thumb|right|alt=Prediction by DOCK depicted in yellow, actual crystal structure depicted in green. |Prediction by DOCK depicted in yellow, actual crystal structure depicted in green. ]] | ||
I want to make the following example: I predicted a fragment binding to the oxyanion hole, but when we determined the crystal structure, the fragment bound to the so-called distal site of AmpC (see picture on the right). In this case I was wondering whether a orientation similar to the crystallographic pose was actually sampled during the docking process. | |||
'''It requires two steps to address this question:''' <br> | |||
1. Use Niu Huang's ligand clustering tool (described here: http://wiki.uoft.bkslab.org/index.php/Dock_Ligand_Clustering) to output all orientations sampled during the docking process. <br> | |||
2. Calculate RMSD values for all orientations compared to the crystal structure pose. You can do this easily and fast using DOCK 6.6 as described here: http://wiki.uoft.bkslab.org/index.php/Calculate_DOCK6_RMSD <br> | |||
'''In this process you will re-dock your ligand and there are (at least) two caveats to this process:''' <br> | |||
1. Niu Huang's ligand clustering tool is a branch of DOCK 3.6 and therefore (most likely) not the same DOCK binary which you have been using in your docking. <br> | |||
2. If you re-dock your ligand starting from a new db file for your ligand (because your ligand was part of a big library and the original db-file is no more available which is often the case when you docked a big ZINC library), then you won't dock the same Omega conformations and the partial charges generated by Amsol (and therefore also the desolvation energies) will also be changed. <br> | |||
That said: it is the best approximation at this point. | |||
===1. Output all orientations sampled during docking=== | |||
To output all orientations sampled during docking, you can add the ~30 lines of code at the bottom of your original INDOCK file (see here how it works: http://wiki.uoft.bkslab.org/index.php/Dock_Ligand_Clustering), and re-dock the ligand into the original grids. | |||
Make sure you set pose_clustering_method to 0 in your INDOCK for ligand clustering (to ensure all poses get written out). | |||
This will output a file called test.eel1.clu, which is a eel1 file with all poses sampled during the docking process. If you want to know how many poses were sampled, type: | |||
grep -c family test.eel1.clu | |||
The answer was 2293 for the small fragment discussed here. | |||
===2. Calculate RMSD values for all orientations compared to the crystal structure pose=== | |||
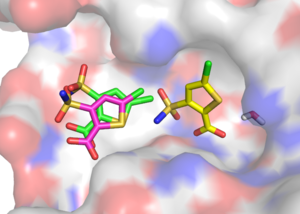
[[File:Nz14 xtal vs dock vs sampled.png|thumb|right|alt=Prediction by DOCK depicted in yellow, actual crystal structure depicted in green, orientation with lowest RMSD value (1.3A) depicted in magenta. |Prediction by DOCK depicted in yellow, actual crystal structure depicted in green, orientation with lowest RMSD value (1.3A) depicted in magenta. ]] | |||
To calculate RMSD values for all orientations generated above (test.eel1.clu) using DOCK 6.6. you have to do execute two programs: <br> | |||
1. Convert test.eel1.clu to a mol2 file without hydrogens (you need the same number of atoms to calculate RMSD values and your crystal structure likely does not have hydrogens). You can use the script eel12pdb_no_H.csh (see code below) to do this: | |||
./eel12pdb_no_H.csh test.eel1.clu | |||
This will output a file called test.eel1.clu_no_H.mol2. | |||
2. Calculate RMSD values for each orientation using DOCK 6.6 as described here: http://wiki.uoft.bkslab.org/index.php/Calculate_DOCK6_RMSD | |||
calc_dock6_rmsd.csh test.eel1.clu_no_H.mol2 nz14_xtal_pose.mol2 | grep RMSDh | sort -rgk 3 | |||
The result of this analysis was that there about a dozen orientations sampled with a RMSD < 2 Angstroem. The closest orientation had a RMSD value of 1.3 Angstroem compared to the crystal structure and is depicted on the right in magenta. Its DOCK score was -30, which was much lower than than the best scoring orientation (DOCK score: -80). | |||
Revision as of 19:19, 8 May 2013
Pose Sampling in DOCK
Don't get right DOCK pose? Well, this happens a lot... Docking is a complicated process, but it can be broken down to two main processes: scoring and sampling. This page is about sampling (in DOCK).
To investigate why you don't get the right DOCK pose (in the case you know the answer from a crystal structure), you can consider the following things:
1. Check if the bioactive conformation is sampled in docking. This is described here: http://wiki.uoft.bkslab.org/index.php/Screen3d
2. Dock the bioactive conformation rigidly. This is described here: http://wiki.uoft.bkslab.org/index.php/Multimol2db.py
3. Run scoreopt on the bioactive conformation to get a score for the crystallographic pose of your ligand. This is described here: http://wiki.uoft.bkslab.org/index.php/Scoreopt
4. Check if a bioactive orientation (or an orientation close to it is actually sampled in the docking process. This is what is described on this page.
Bioactive conformation sampled?
I want to make the following example: I predicted a fragment binding to the oxyanion hole, but when we determined the crystal structure, the fragment bound to the so-called distal site of AmpC (see picture on the right). In this case I was wondering whether a orientation similar to the crystallographic pose was actually sampled during the docking process.
It requires two steps to address this question:
1. Use Niu Huang's ligand clustering tool (described here: http://wiki.uoft.bkslab.org/index.php/Dock_Ligand_Clustering) to output all orientations sampled during the docking process.
2. Calculate RMSD values for all orientations compared to the crystal structure pose. You can do this easily and fast using DOCK 6.6 as described here: http://wiki.uoft.bkslab.org/index.php/Calculate_DOCK6_RMSD
In this process you will re-dock your ligand and there are (at least) two caveats to this process:
1. Niu Huang's ligand clustering tool is a branch of DOCK 3.6 and therefore (most likely) not the same DOCK binary which you have been using in your docking.
2. If you re-dock your ligand starting from a new db file for your ligand (because your ligand was part of a big library and the original db-file is no more available which is often the case when you docked a big ZINC library), then you won't dock the same Omega conformations and the partial charges generated by Amsol (and therefore also the desolvation energies) will also be changed.
That said: it is the best approximation at this point.
1. Output all orientations sampled during docking
To output all orientations sampled during docking, you can add the ~30 lines of code at the bottom of your original INDOCK file (see here how it works: http://wiki.uoft.bkslab.org/index.php/Dock_Ligand_Clustering), and re-dock the ligand into the original grids. Make sure you set pose_clustering_method to 0 in your INDOCK for ligand clustering (to ensure all poses get written out).
This will output a file called test.eel1.clu, which is a eel1 file with all poses sampled during the docking process. If you want to know how many poses were sampled, type:
grep -c family test.eel1.clu
The answer was 2293 for the small fragment discussed here.
2. Calculate RMSD values for all orientations compared to the crystal structure pose
To calculate RMSD values for all orientations generated above (test.eel1.clu) using DOCK 6.6. you have to do execute two programs:
1. Convert test.eel1.clu to a mol2 file without hydrogens (you need the same number of atoms to calculate RMSD values and your crystal structure likely does not have hydrogens). You can use the script eel12pdb_no_H.csh (see code below) to do this:
./eel12pdb_no_H.csh test.eel1.clu
This will output a file called test.eel1.clu_no_H.mol2.
2. Calculate RMSD values for each orientation using DOCK 6.6 as described here: http://wiki.uoft.bkslab.org/index.php/Calculate_DOCK6_RMSD
calc_dock6_rmsd.csh test.eel1.clu_no_H.mol2 nz14_xtal_pose.mol2 | grep RMSDh | sort -rgk 3
The result of this analysis was that there about a dozen orientations sampled with a RMSD < 2 Angstroem. The closest orientation had a RMSD value of 1.3 Angstroem compared to the crystal structure and is depicted on the right in magenta. Its DOCK score was -30, which was much lower than than the best scoring orientation (DOCK score: -80).

