C. Validating an unusual interaction using substructure searching in Relibase
In order to investigate the unusual interaction between the chloride atom and the phenyl ring found in the structures 1nfy, 1nfx and 1nfw we will perform a search of the PDB for similar interactions.
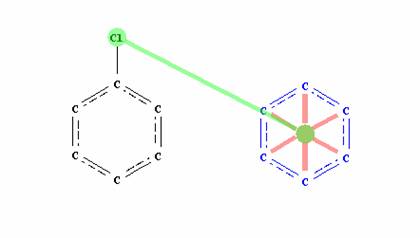
i) Return to the Sketcher of Relibase+ and draw the following two structures:
ii) Choose Select from the left-hand side of the sketcher and draw a box around the unsubstituted phenyl ring. Select protein at the bottom of the screen, this tells Relibase+ that the phenyl ring is part of the protein structure (make sure that the chlorobenzene is of ligand-type).
iii) The next step is to define an interaction between two substructures. Click on Add 3D. Go back to the sketcher and re-select the phenyl ring. In the Add 3D dialog there will now be an option to define either a centroid or a plane. Select Centroid Define. Keeping the Add 3D dialog open, return to the Sketcher and select the chloride atom. In the Add 3D dialog select the previously created centroid CENT1 and define a Distance. Click Done, the Add 3D dialog will close and you will be returned to the Sketcher. On the right side of the Sketcher the parameter D1 will now be visible, click on D1 to see the defined distance. Click on the Options.. beneath the 3D-parameters box. This will allow you to define the distances between the two substructures. Leave the lower limit default and write 4.2 in the Upper limit box, then click OK then Done in the 3D-box. Re-select the phenyl ring and click the Search button – tick the Superimpose hits on selected atoms. This will superimpose the phenyl rings of the search hits in order to get a scatter plot of the interactions, similar to that of IsoStar. Start the search.
iv) The search will yield roughly 150 hits. Examine the interactions in the embedded visualiser. The observed interaction seem to be quite common one. Click on Histogram(s) to see the distribution of the defined parameter D1. How does the measured interaction for 1nfy compare to the structures in Relibase+?
This ends the workshop Back to Start
